Market cap in crypto is a token’s price multiplied by its circulating supply: the coins a data site counts as already out in the market. Fully diluted valuation (FDV) multiplies the same price by the maximum (or total) supply, so it also counts tokens that are still locked, vesting or not yet issued. When a big share of supply is still to come, market cap can look small next to FDV, and every unlock adds supply to the market. Neither number is money anyone invested or could take out, and CoinMarketCap and CoinGecko do not always calculate them the same way.
You open a token page and see three or four big dollar figures at the top: market cap, FDV, volume, sometimes TVL. Most explainers stop at “price times supply” and a size tier. That leaves out the questions that actually matter when you read those numbers: which supply is being counted, how much is still locked, when it unlocks, and whether the figure has anything to do with real money. This guide explains market cap and FDV with a worked example, shows a dated real-world snapshot from two data sites, and covers what market cap does not tell you.
What is market cap in crypto?
Market capitalisation (market cap) is the current price of a coin or token multiplied by its circulating supply. It gives you one number for the size of a crypto asset at today’s price, so you can compare assets with very different unit prices.
Both of the biggest data sites use this formula. CoinGecko’s methodology page states market cap as the current price in USD times the circulating supply, and CoinMarketCap’s FAQ describes it as “one way to rank the relative size of a cryptocurrency”, calculated the same way (both checked 14 October 2026).
A quick illustration with made-up numbers: a token at $0.10 with 5 billion units circulating has a $500 million market cap. A token at $500 with 100,000 units circulating has a $50 million market cap. The cheaper-looking token is ten times bigger by market cap. That is the main point of the metric: unit price on its own tells you almost nothing about size.
Circulating, total and max supply: which number is used?
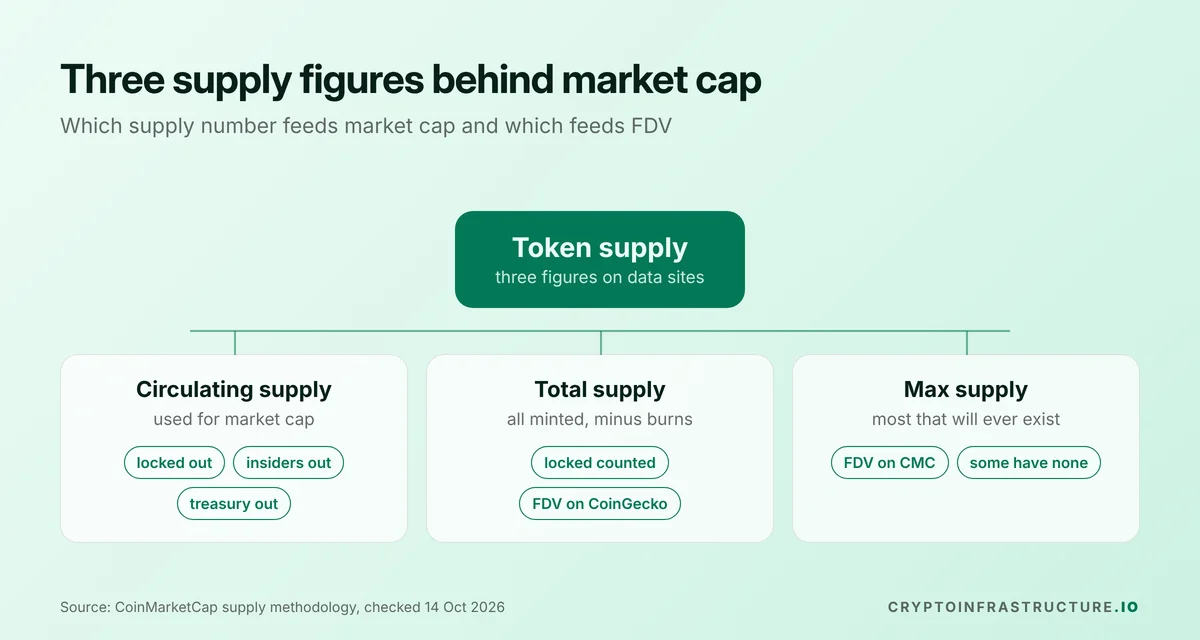
The formula is simple. The hard part is the supply figure, and data sites publish three of them. CoinMarketCap’s supply methodology (updated 25 September 2026) defines them like this:
| Supply figure | What it counts | Used for |
|---|---|---|
| Circulating supply | The best approximation of the units circulating in the market. Locked tokens, insider allocations and tokens that cannot be sold on the public market are generally left out. | Market cap |
| Total supply | All units in existence right now, minus any verifiably burned. Includes tokens that are minted but locked or held by the team or treasury. | “Minted market cap” on CoinMarketCap; FDV on CoinGecko, and on both sites when no max supply is listed (see ETH below) |
| Max supply | The best approximation of the most units that will ever exist, minus verifiable burns. Some assets have none. | FDV |
Source: CoinMarketCap supply methodology (checked 14 October 2026).
CoinMarketCap’s list of what usually does not count as circulating is worth knowing: private-sale allocations, ecosystem, marketing and airdrop reserves, team, foundation, treasury and escrow wallets, and unlocked buyback tokens. It also says that a token being technically unlocked does not, on its own, make it circulating. Staked and masternode tokens are judged case by case.
CoinGecko works the other way round for smart-contract tokens: it calculates circulating supply by deducting locked tokens, such as foundation funds and investors’ and team’s locked tokens, from total supply, using the locked addresses that token teams supply (CoinGecko methodology, checked 14 October 2026). Both sites rely on the project to tell them which wallets are locked and then verify what they can. CoinGecko shows a “-” when it cannot verify a circulating figure, and CoinMarketCap shows a question mark.
So the circulating supply behind every market cap is partly a judgement call, made with information from the project itself. That is the first reason market cap is softer than it looks.
What is FDV in crypto?
Fully diluted valuation (FDV) is the token’s current price multiplied by its maximum supply, or by total supply where there is no max. It answers a narrower question than market cap: what would all the tokens be worth at today’s price if every one of them were already in the market?
CoinMarketCap gives the formula as max supply times price. CoinGecko’s glossary defines FDV as the theoretical market cap “if the entirety of its supply is in circulation”, and its own FDV explainer (updated 9 June 2025) uses total supply times price. When max and total supply are the same, as they are for many tokens with a fixed mint, the two methods give the same answer.
Where they matter is assets with no max supply. On 13 October 2026, around 20:45 UTC, both CoinGecko and CoinMarketCap showed Ether (ETH) with an FDV almost identical to its market cap, about $306 billion, because circulating and total supply were the same 122.13 million ETH and no max supply was listed. CoinGecko’s FDV explainer says tokens without a max supply have no FDV statistic, but its own ETH page did show one. The lesson: for an asset with ongoing issuance, the FDV on a data site is usually based on today’s total supply and says nothing about tokens still to be created.
Why FDV often matters more than market cap
For a mature asset where nearly all supply is already circulating, market cap and FDV are close and either one works. For a newer token where most of the supply is still locked, market cap measures only the slice that trades today, and FDV is the figure that includes the rest.
The gap between them is often shown as a ratio: market cap divided by FDV. A ratio of 1.0 means the full supply is already counted as circulating. A ratio of 0.2 means only a fifth of the supply is out, and the other four-fifths will reach the market over time, through unlocks, emissions or treasury spending, unless they are burned.
Why that matters to you as a reader of these numbers:
- Market cap is a moving base. If circulating supply grows and price stays flat, market cap rises with no new demand at all. A rising market cap is not proof that money flowed in.
- Each unlock adds supply. Tokens released to early investors, team members or ecosystem funds can be sold. Whether they are sold is not knowable in advance, but the supply is there.
- A low market cap next to a high FDV is not a bargain signal. It describes how much supply is still to come at today’s price. It says nothing about whether that price will hold.
Analysts are not unanimous on how much weight to give FDV, and that is reasonable: FDV can overstate value for tokens where much of the supply sits in a treasury that may never be spent, and understate dilution for tokens with open-ended emissions. It is a ratio to check, not a verdict.
A worked example: how unlocks change market cap without new money
This example uses entirely hypothetical numbers for a made-up token, called Token X here. It is not based on any real project.
| Input | Value |
|---|---|
| Price | $2.00 |
| Circulating supply | 100 million |
| Max supply | 1 billion |
| Unlock schedule | 25 million tokens a month for the next 12 months (team and investors) |
Today:
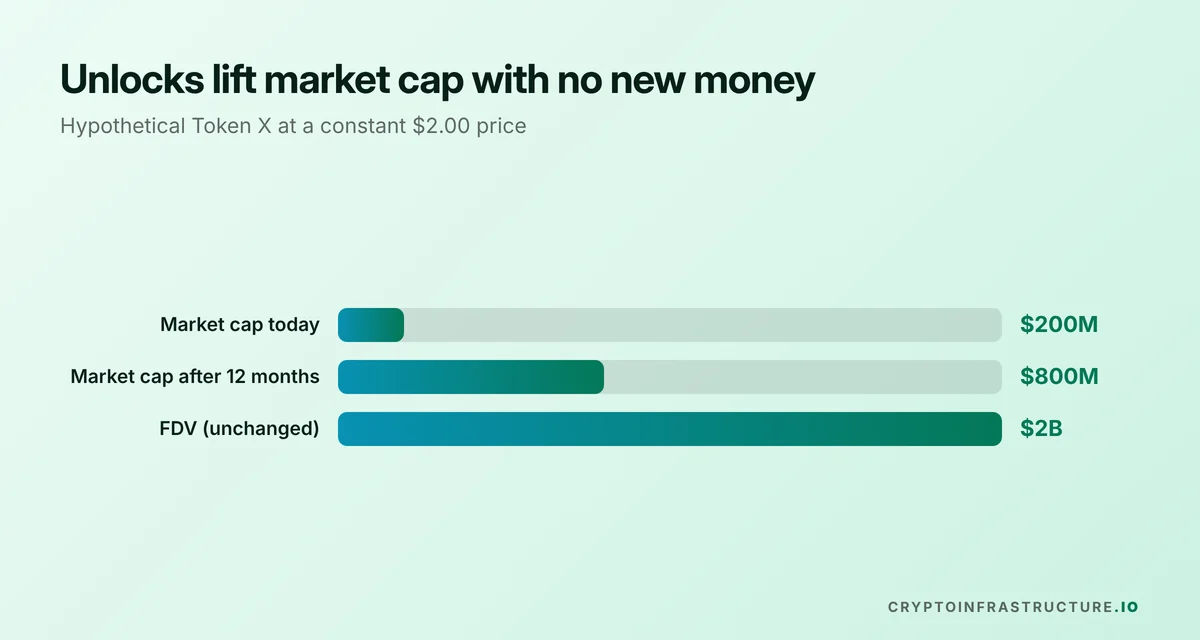
- Market cap = $2.00 × 100 million = $200 million
- FDV = $2.00 × 1 billion = $2 billion
- Market cap / FDV = 0.10, so 90% of the supply is not yet circulating
After 12 months of unlocks, circulating supply is 100 million + (25 million × 12) = 400 million. If the price were still exactly $2.00:
- Market cap = $2.00 × 400 million = $800 million, four times larger, with no new buyers needed
- FDV = still $2 billion, because max supply did not change
The holding-price-constant assumption is only there to isolate the supply effect. In real markets, 300 million newly sellable tokens worth $600 million at that price would have to be absorbed by buyers, and nobody can say in advance at what price that would happen. That is the core reason FDV and the unlock schedule tell you more than market cap alone for a token like this.
Unlock schedules and vesting, briefly
Most token projects publish a distribution table and a vesting schedule: how much of the supply goes to the team, investors, the community and a treasury, and when locked portions are released. A common pattern is a cliff (nothing released for a set period, often one year) followed by monthly or linear unlocks. The full mechanics of token design belong to tokenomics, which deserves its own guide. For reading market cap, you only need three things from a project’s own docs: the total allocation, the share still locked, and the dates it unlocks.
A real snapshot: ARB on two data sites
To see the concepts on live data, here is Arbitrum’s ARB token as two data sites reported it on 13 October 2026, around 20:45 UTC. This is a dated illustration of how the metrics work, not a view on the token.
| Metric | CoinGecko | CoinMarketCap |
|---|---|---|
| Market cap | $1.29 billion | $1.28 billion |
| FDV | $1.91 billion | $1.89 billion |
| Circulating supply | 6.79 billion ARB | 6.78 billion ARB |
| Total supply | 10 billion ARB | 10 billion ARB |
| Max supply | 10 billion ARB | 10 billion ARB |
| Market cap / FDV | 0.68 | about 0.68 (calculated) |
| 24-hour trading volume | $189.8 million | $181.5 million |
Sources: CoinGecko public API (last updated 13 October 2026, 20:43 UTC) and the CoinMarketCap ARB page (read 13 October 2026, around 20:45 UTC). Small differences come from timing, price sources and each site’s supply figures.
What the project’s own docs add:
- The Arbitrum Foundation’s distribution page (checked 14 October 2026) gives an initial supply of 10 billion ARB, with 26.94% to the team, contributors and advisors and 17.53% to investors.
- It says all investor and team tokens are subject to four-year lockups, with the first unlocks one year after the token generation event on 16 March 2023, then monthly unlocks for the remaining three years. On that schedule, those allocations finish unlocking around March 2027.
- The same page lists inflation of up to 2% a year. Both data sites show a max supply of 10 billion, the initial supply. If that inflation were ever used, the “max supply” on data sites would no longer be a hard ceiling, and FDV would understate the eventual supply.
Reading the snapshot: about 3.2 billion ARB (32% of the 10 billion) was not counted as circulating on CoinGecko, likely including team and investor tokens still on the unlock schedule and DAO treasury and foundation holdings. The data sites do not break down which is which; the project’s docs and on-chain wallets are where you check that.
Market cap is not money in the asset
A $1 billion market cap does not mean $1 billion was invested, and it does not mean $1 billion could be taken out. It is the last traded price applied to every circulating unit, including the ones that have not changed hands in years. Two consequences:
- Thin trading can move market cap a lot. If a token trades on few venues with little depth, a small amount of buying or selling can shift the price, and with it the market cap of the whole supply.
- Selling a large amount would move the price. Nobody could sell the entire circulating supply at the quoted price. How much you could sell before the price moves depends on order book depth, not on market cap.
Market cap vs liquidity and volume
Liquidity is how easily an asset can be bought or sold without moving its price. It shows up in order book depth and bid-ask spreads, not in market cap. CoinGecko’s trust score, for instance, looks at spreads and the order book depth within 2% of the price, and its May 2026 “Basilisk” update put more weight on direct volume and depth evaluation (methodology page, checked 14 October 2026).
Trading volume is a rough proxy. In the ARB snapshot above, 24-hour volume on CoinGecko was about 15% of market cap. Reported volume can also be inflated, which is one reason CoinMarketCap says it excludes markets with no trading fees from its price average and volume entirely (FAQ, checked 14 October 2026). The “liquidity to market cap ratio” that some tools show is a way of putting these two numbers side by side; it is a check, not a rating.
Market cap vs realised cap
Realised capitalisation values each coin at the price when it last moved on-chain, instead of today’s price. Coin Metrics defines realised market cap as the sum USD value based on the closing price on the day each unit last moved (checked 14 October 2026). It works for chains where you can trace each unit’s last movement, such as Bitcoin’s unspent outputs, and is often read as a rough picture of the aggregate cost basis of holders.
Coin Metrics also publishes a free-float market cap, which excludes supply held by company insiders, controlling investors and long-term strategic holders. Having market cap, free-float market cap, realised cap and FDV side by side is a good reminder that “market cap” is a family of estimates, not one fact.
Market cap vs TVL
Total value locked (TVL) measures something different: the value of assets users have deposited in a DeFi protocol’s smart contracts. DefiLlama defines it as the total value locked inside a protocol’s own contracts by users, and separates out categories such as staking of the protocol’s own token, borrowed funds and vesting tokens so they can be toggled off (checked 14 October 2026). Market cap values the protocol’s token; TVL values the deposits it holds. Comparing the two (market cap divided by TVL) is a common ratio in DeFi analysis, with all the same caveats. For how DeFi deposits work, see what DeFi is and where the risks are.
How data sites differ in methodology
In the ARB and ETH snapshots above, CoinMarketCap and CoinGecko agreed within about 1.5% on market cap, but you will see different numbers for the same token at the same moment. The reasons are worth knowing:
| Area | CoinMarketCap | CoinGecko |
|---|---|---|
| Circulating supply | Verified with the project team; excludes locked, insider, treasury and similar allocations; unlocked status alone does not make a token circulating | Total supply minus locked tokens, using locked addresses supplied by the team and read from block explorers |
| FDV formula | Max supply × price | Total supply × price (FDV explainer, June 2025) |
| No max supply | FDV shown close to market cap (ETH, 13 October 2026) | Explainer says no FDV, but FDV shown equal to market cap (ETH, 13 October 2026) |
| Unverified supply | Marked with a question mark | Marked with “-“ |
| Price | Averaged across markets, excluding zero-fee markets | Volume-weighted average across tickers after removing outliers |
Sources: CoinMarketCap supply methodology and FAQ; CoinGecko methodology, glossary and FDV explainer; both sites’ ETH pages. All checked 13 to 14 October 2026.
Practical habit: when a number matters to you, check it on two sites and then against the project’s own documentation and the token contract on a block explorer. If the sites disagree a lot on circulating supply, that disagreement is information in itself.
How much market cap is “good” for a crypto?
There is no good or bad market cap. It is a size measure. Some guides sort assets into large-cap, mid-cap and small-cap tiers, for example above $10 billion, $1 billion to $10 billion and below $1 billion, but those cut-offs are conventions that vary between sources, not standards.
What size does tell you, in general terms: smaller assets tend to trade on fewer venues with thinner order books, so their prices can move more on less money and can be easier to push around. A bigger market cap is not a quality rating either. It reflects price and the supply a data site counts, nothing more. The same goes for FDV: Google’s own summary on the question “is a fully diluted market cap good?” rightly says it is neither good nor bad, just a measure of potential dilution.
Rankings like “top 10 by market cap” change daily and differ slightly between data sites. Use the live ranking pages for that, and read the supply figures behind each entry rather than the rank alone.
Common mistakes when reading market cap
- Judging by unit price. A $0.01 token is not “cheap” and a $1,000 token is not “expensive”. Only price times supply means anything.
- “It only needs to reach X’s market cap.” Comparing a small token’s market cap with a large one’s and multiplying the price is not analysis. Market cap is an output of price and supply, not a target.
- Ignoring the circulating share. A token with a 0.1 market cap to FDV ratio and one with a ratio of 1.0 can show the same market cap and face completely different supply over the next few years.
- Treating max supply as fixed. Check the project’s docs for inflation, emissions or mint permissions. A listed max can be the initial supply rather than a hard cap.
- Treating market cap as invested money. It is a mark-to-last-price figure, not capital in or capital out.
- Trusting one data site. Circulating supply relies on project-provided information and each site’s own rules.
What this means for you
Market cap is a useful way to compare the size of crypto assets at a moment in time, as long as you remember what is in it: a quoted price times a supply figure that a data site estimated with help from the project. For any token where a large share of supply is still locked, look at FDV, the market cap to FDV ratio and the project’s own unlock schedule before you treat market cap as the full picture. Then look at order book depth and volume to understand how much of that value could actually trade.
None of these numbers tells you whether a token is worth buying, and a low market cap next to a large FDV is a description of future supply, not an opportunity. For how this site sources figures like these, read the methodology, and find more plain-English explainers in Guides, including how Bitcoin’s fixed supply schedule works and what a stablecoin is.